Comparing Newspaper Vs Radio Advertisements
| ✅ Paper Type: Free Essay | ✅ Subject: Marketing |
| ✅ Wordcount: 1184 words | ✅ Published: 02 Oct 2017 |
Body shock Ltd. is a nationwide chain of fitness centers with giving many facilities for their customers in most major towns in the UK. The Company CEOs and HR management believe strongly in the role of local advertising to stimulate their services and thus spend money with local radio stations and papers. The Company employs both radio and newspaper services for advancing their work and experience.
In my peak of view newspapers advertisement is much more effective and considering for enhancing their line of work. As newspaper reading habit in the UK is much more than people like to listen radio. In UK reading habit is addicted by the great unwashed. If Company advertise their services in the newspapers there can be two benefits first people read more newspaper as compare to listen radio and secondly, if they require to revise or giving consultation for that advertisement can access that easily.
Here are some work sample with graphs and histograms to show that Yes! My point of view for advertising in newspapers are more effective than that to listen radio. At first we will show the descriptive statistics which means “are used to describe the basic features of the data in a study. They provide simple summaries about the sample and the measures. Together with simple graphics analysis, they form the basis of virtually every quantitative analysis of data.” (William M.K. Trochim 2006).
In the descriptive statistics the news has a maximum number up to 12 thousand whereas the radio maximum value is up to 11 thousand. The result again emphasis my analysis that advertisement in newspapers is much more effective than to radio. The data taken is about 45 values whose mean value again emphasizes on newspapers.

Today the second evidence will be accepted from the boxplot values as we have withdrawn from these above taken values and will demonstrate how the newspaper advertisement is much safer and effective than listen to the wireless. “A boxplot is a way of summarizing a set of data measured on an interval scale. It is often used in exploratory data analysis. It is a type of graph which is used to show the shape of the distribution, its central value, and variability. The picture produced consists of the most extreme values in the data set (maximum and minimum values), the lower and upper quartiles, and the median.” (Valerie J. Easton and John H. McColl’s 1998).

If we examine the boxplot graph closely, we can catch the radio box and its upper limit is less than 9000 value, whereas the news box and its upper value is above 9000. Which clearly implies that newspapers upper limit is high that to radio. This again justifies my point and analysis techniques as well.
The boxplot and the Histogram in both statistical analyses, we clearly examine and can suggest to the troupe that they should be made to the company expenditure on news greater than the quantity of money spent on radio. The data on news skews more to the right, due to the fact that the mean and median for news are higher than for the tuner radio. People or can say audience for the advertisement is more emphasis on intelligence (reading material) rather than wireless (radio).
2 Sample T-test

The 2 sample t-test shows that the estimated difference between means is -794.9. The P value is 0.0457 which is lower than 0.05 that is why we reject the Null hypothesis and follow the Alternative one. There is not enough evidence to conclude that the difference between the population means is statistically significant. So with a 95 percent confidence interval we can assume that mean is between -1574.3 and -15.5


If we analysis all the above given facts and figures we should be very clear in our minds that yes the advertisement source can be of many types but as we compare here two radio and newspapers in that case newspapers get best in this case and suggested to the body shock company to expend its expenditures on newspapers for the advertisement. In which they can focus on different scenarios like prices and giving facilities etc.
The values given by the statistics analysis by taking 45 samples, maximum value for the radio is about 11 thousand whereas the maximum value for the news is about 12 thousand which is higher value than that. Means the newspaper is best for advertisement for the company rather than radio for this purpose.
PART2:
According to data given, rise and fall on histogram statistcis is proceeding in same manner for both advertising medium.however this rise rise in magnitude is more for news in comparison with radio as shown in statistical figure below.

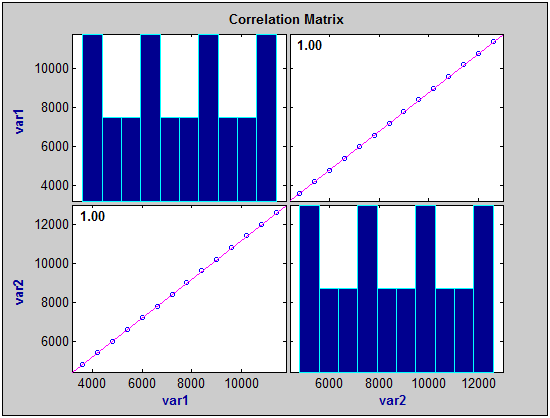
To esmitae the future cost and current expenditure of company on these two medium the correlation among data is analyzed whose result is mentioned below.


Since the results shows that correlation coefficients are all equal to 1 means that there is a strong corelation among the two variable. Increase and decrease in both medium expenditure is similar so in order to further increase the impact of advertisement, company may cut down some of its expediture from radio and expend more on news because news is giving better opportunity to enhance its awareness.
Moreover best line fit model is used to analyse the way of effective advertisement based of expense company is making on these two.

Result of line fitting model also shows that news are the best option for reducing company expense on marketing. As the cost on each advertisement are almost similar but the affect are much visible for news. Line model is nearer to many point of news (red circles in line model figure) hence it is suggested to cut down some the expense from radio communication. This will be beneficial for company’s economic as well as for people getting information from paper and news resources.
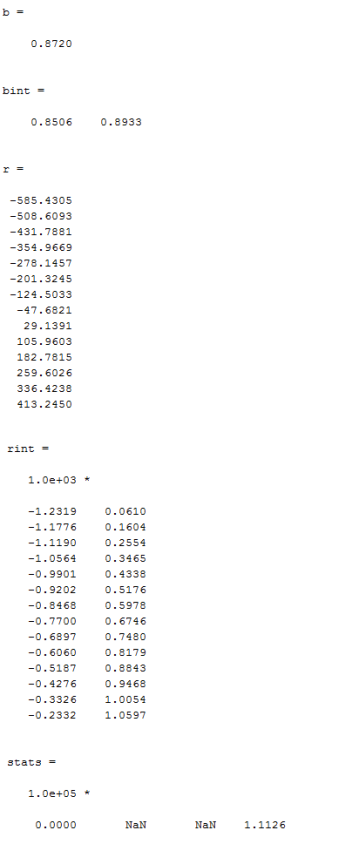
Another statistic using regression model is carried out for both news and radio advertisement. Results shows that their upper and lower bounder for both are near around each other since they have similar trend of cost. Also the values in stats result of regression shows that estimated error is small when news are considered as predictor in regression.


Also as stated in part above the P value is 0.0457 for advert which is lower than 0.05. And the values of p which is less than 0.05 are suggested to use alternative value instead of null hypothesis therefore here the null hypothesis is rejected and alternative hypothesis will be preferred.
Considering all figures and results it is suggested to use news as a much appropriate medium of advertisement. The reduction in cost of radio will give economic strength to the company and also the enhanced way of advertising on news will give smooth communication and awareness among people. Future spending of company must rely mostly on news and thereby currents expense stats must be changed.
References:
1: William M.K. Trochim 2006, Research Methods: Knowledge base, Web center for social research methods,” http://www.socialresearchmethods.net/kb/statdesc.php”, last Revised: 10/20/2006
2: Valerie J. Easton and John H. McColl’s 1998, Statistics Glossary, v1.1, http://www.stat.yale.edu/Courses/1997-98/101/boxplot.htm
Cite This Work
To export a reference to this article please select a referencing stye below:
Related Services
View allDMCA / Removal Request
If you are the original writer of this essay and no longer wish to have your work published on UKEssays.com then please click the following link to email our support team:
Request essay removal


