Relationship between GDP and Total Factor Productivity
| ✓ Paper Type: Free Assignment | ✓ Study Level: University / Undergraduate |
| ✓ Wordcount: 3532 words | ✓ Published: 14 Apr 2020 |
Macroeconomic background
1. Find GNP/GDP data for the last 5 years. Plot the growth rate. Compute total factor productivity (TFP) and plot the results for that period. Show how the TFP numbers are calculated according to the formula derived in class. (You may use published TFP numbers, but you are still required to show how they are being derived.)
The Gross National Product (GNP)[1] and Gross Domestic Product (GDP)[2] are economic indicators of the strength and size of a given nation’s economy[3] by measuring the amount of goods and services produced – ‘output’ (Sussman, 2019). Thus, we want to focus on the value added, which is the “difference between the value of output sold and the cost of intermediate inputs and raw materials” (Miles et al., 2012, p. 17)[4]. The total market value of the final[5] goods and services produced in a country’s boarders within a certain time period[6] is known as GDP (WallStreetMojo, 2019)[7].
Q1 2019 UK GDP growth was 1.8%, year-on-year[8] (Figure 1). This larger than expected growth has been due to a boost from companies in the UK and European Union building stocks ahead of recent Brexit[9] deadlines. This is deemed a temporary effect, with growth expecting to slow to in Q2 (Bank of England, 2019).[10] Indeed, the overall pattern of growth over the past 5 years has been subdued[11].
Figure 1 – GDP Year-on-Year Quarterly Growth, CV[12] (Past 5 years)
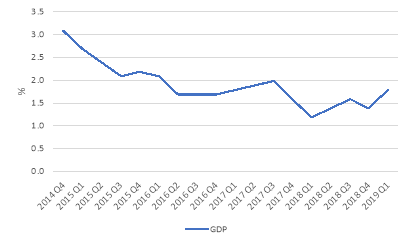
Source: ONS
GDP is in essence produced by three factors: (1) capital; (2) labour; and (3) total factor productivity (TFP).[13] TFP is the measure of the efficiency of all inputs to a production process that cannot be attributed to the accumulation of capital and labour (Investopedia, 2019) – it is, hence, calculated as a residual. Increases in TFP result usually from technological innovations[14], institutional or government policies[15], education and skills in the workforce[16], to name a few[17] (Hulten, 2000).
It is derived by dividing output, GY, by the weighted average of labour, GL, and capital input, GK, with the standard weighting of 0.6 for labour, SL, and 0.4, SK, for capital (Sussman, 2019). The rate of TFP growth is calculated by subtracting growth rates of labour and capital inputs from the growth rate of output:
TFP = GY – (SK x GK+ SL x GL)
For Q1 2019, TFP growth was -4.5% (Figure 2): 13.1% – (0.4 x 15.3% + 0.6 x 19.1%). Over the past 12 months, input growth has been matched by output growth (Figure 3), with TFP flat-lining during the same period (ONS, 2019). The negative TFP growth the UK is exhibiting is a concern as it is a “source of long-run growth” for the economy (Miles et al., 2012, p. 51).[18]
Figure 2 – Cumulative Quarterly TFP (Past 5 years)
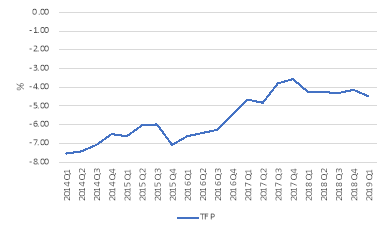
Source: ONS.
Figure 3 – Decomposition of Cumulative Quarterly Output Growth (Past 5 years)
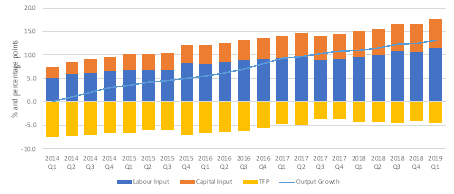
Source: ONS. Output growth is the cumulative q-o-q logarithmic change in GVA (market sector gross value added).
Bar chart shows contributions of components, calculated by weighting logarithmic changes in each component by its factor income share.
2. What is the earnings yield (inverse of the price-to-earnings ratio) in the domestic stock market? Is this number compatible with the performance of the economy as analysed in the previous question?
The earnings yield[19] refers to the earnings per share of a company divided by the current market price per share (Investopedia, 2019).[20] The Q1 2019 earnings yield of the UK’s broad domestic market index (FTSE 100) is currently 5.9%; this represents a 200% increase since Q1 2016 (Figure 4). A comparison of the yield on long-term government debt and the average yield on an equity market benchmark, Bond Equity Earnings Ratio (BEER), can be used to determine whether to invest in stocks.[21] If the ratio is above 1.0 then the stock market is said to be overvalued[22]. The FTSE’s current ratio is 0.2, which illustrates that UK equities are an attractive investment (Figure 5).[23]
Figure 4 – FTSE 100 Earnings Yield vs. 10 Year Treasury Yield (Past 5 years)
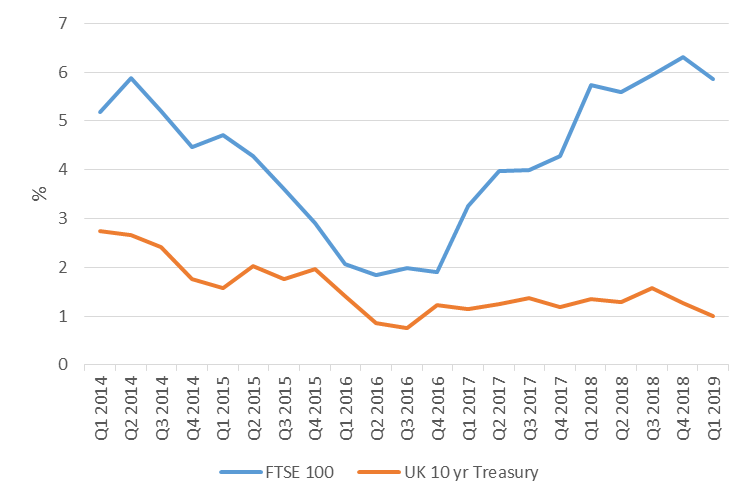
Source: Bloomberg
Figure 5 – BEER (Past 5 years)
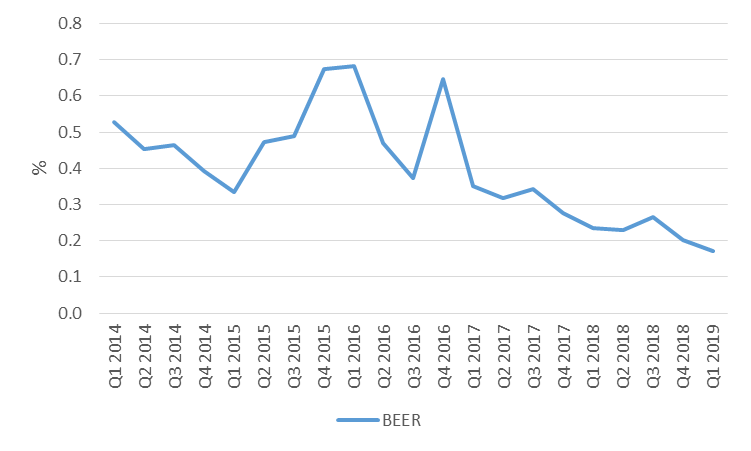
Source: Bloomberg
Figures 6 illustrates an incompatibility between the earnings yield of the FTSE 100 and the UK’s economic performance, or GDP. Intuitively, at least, high GDP growth rates should translate into high stock market returns.[24] However, investigation shows that, at least in China, GDP growth rate do not translate into stock price appreciation. When China had growth rates between 9% to 15% from 2007 to 2011, its Shanghai Composite Index dived from 5,500 to below 2,500 (Wu, 2012). Furthermore, Dimson et al. (2002) and Ritter (2005) in separate studies of 16 and 19 developed countries, respectively, found that stock market returns were negatively related to GDP growth rates.
Figure 6 – FTSE 100 Earnings Yield vs. UK GDP Growth (Past 5 years)


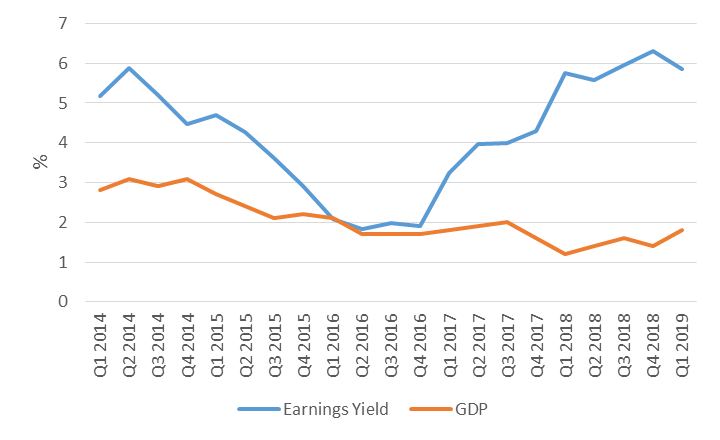
The Earnings Yield has been rising since 2016, although GDP growth has been on the decline over the past 5 years.
I submit that a robust linkage between earnings yield and GDP does not exist due to three principal reasons. Firstly, the stock market does not full represent the whole economy. GDP includes all public, private, government-owned and newly founded companies, whilst stock market returns only account for public companies (Jain & Krason, 2009). Secondly, a company’s profits may come from overseas, especially where economies are becoming more interdependent. For instance, the FTSE 100 is dominated by resource companies[25], who predominantly conduct their operations outside of the UK. Thirdly, the value of current investors’ shares may be diluted if a company issues additional shares to raise capital (Wu, 2012).[26] Thus, when making equity investment decisions, a micro-level, bottom-up, approach, is advisable. In conclusion, one should consider the company and industry prior to investment at a country-level.
3. Find data for the price level and calculate the rate of inflation for the last 5 years. What was the nominal interest rate? What was the real interest rate?
“A price level is the average of current prices across the entire spectrum of goods and services produced in the economy” (Investopedia, 2019). It, hence, denotes the buying power of money (Sussman, 2019).[27] “The rate of inflation is the change in prices for goods and services over time” (ONS, 2019).[28] The Consumer Price Index including owner occupiers’ housing costs (CPIH)[29] is the UK’s leading inflation index[30]. As of May 2019, CPIH stood at 1.9% (Figure 6). This Represents the 12-month inflation rate, down from 2% in April, due to falling fares for transport services and car prices (Figure 7). [31]
CPIH measures the cost to the consumer of purchasing a basket of commodities, in which a collection of prices for goods and services[32] are “weighted together based on how much the average consumer spends on each item” (Miles et al., 2012, p. 287).[33]
Figure 6 – CPIH Annual Time Series (Past 5 years)
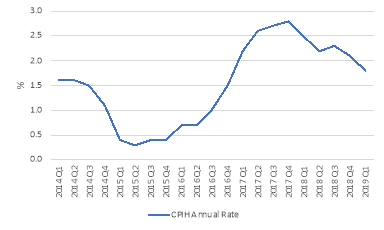
Source: ONS
Figure 7 – Contributions to Change in CPIH Annual Rate (April to May 2019)
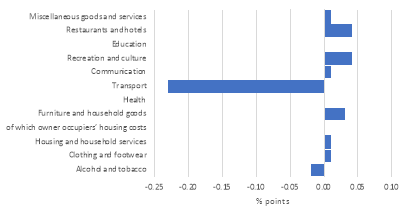
Source: ONS
A nominal interest rate refers to the interest rate before taking inflation into account.[34] Short-term nominal interest rates are set by the Bank of England and is currently set at 0.75% (Figure 8).[35] The Bank of England has evidently kept nominal rates at low levels in order to spur economic activity following the global financial crisis of 2008 (Figure 9). In general, as interest rates are lowered, more people are able to borrow more money. The result is that consumers have more money to spend, causing the economy to grow and inflation to increase.[36] This relationship is indeed evident in Figure 10.
Figure 8 – Nominal Interest Rate (Past 5 years)
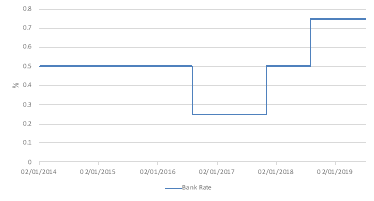
Source: Bank of England
Figure 9 – Nominal Interest Rates (Historical Time Series)


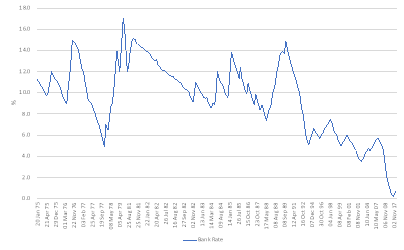
Global Financial Crisis 2008
Source: Bank of England
Figure 10 – Nominal Interest Rates vs. Inflation (Historical Time Series)


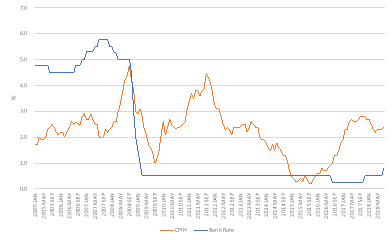
A reduction in interest rates in 2009 has increased consumer spending, CPIH, in the UK
Source: Bank of England, ONS.
However, the disadvantage of using the nominal interest rate is that it does not adjust for the inflation rate. Fisher (1930) postulates that the real interest rate – that takes inflation into account – is independent of monetary measures, especially the nominal interest rate (Investopedia, 2019).
The Fisher Effect is an economic theory that describes the relationship between inflation and both nominal and real interest rates (Investopedia, 2019):
r = i – π
Where the real interest rate (r) equals the nominal interest rate (i) minus the rate of inflation (π).[37] Hence, “real interest rates fall as inflation increases, unless nominal rates increase at the same rate as inflation” (Investopedia, 2019). The real interest rate as of Q1 209 is -1.2%. Indeed, as illustrated by Figure 11, real interest rates have been consistently negative since 2015 due to the fact that the nominal rate has been set lower than the inflation rate in recent years.[38]
Figure 11 – Real Interest Rate (Past 5 years)
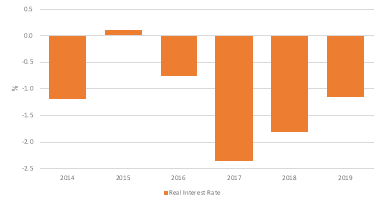
Source: Bank of England, ONS.
4. Find money supply data for your country. Can you find correlations between the money supply and the rate of inflation?
“The money supply is the entire stock of currency and other liquid instruments circulating in a country’s economy as of a particular time” (Investopedia, 2019).[39] There are just two official UK measures of money supply pertaining to the spectrum of liquidity, or spendability of such financial assets[40]. M0 is referred to as the “wide monetary base” or “narrow money” and M4 is referred to as “broad money” or simply “the money supply”.
- M0: equates to sterling notes and coin in circulation outside the Bank of England (Bank of England, 2019).[41]
- M4: comprises of cash outside banks (i.e. in circulation with the public and non-bank firms); private-sector retail bank and building society deposits; private-sector wholesale bank and building society deposits; and certificates of deposit (Wikipedia, 2019).
M4 is a key economic indicator of the underlying strength of economic activity. For instance, when the global economy went into recession in 2008, we saw a sharp fall in UK M4 growth from 15% a year to negative growth (Figure 12).[42] Conversely, narrow money growth has remained constant and was less impacted by the financial crisis (Figure 13). That said, M0 is a relatively small percentage of the total money supply.[43]
Figure 12 – M4 Quarterly 12-month growth rate, seasonally adjusted (1989-2019)


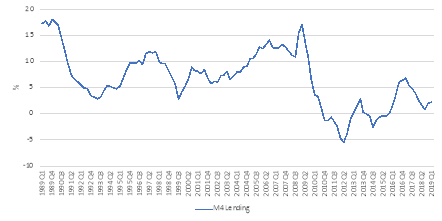
Global Financial Crisis 2008
Source: Bank of England.
Figure 13 – Monthly Average Outstanding of Sterling Notes and Coins in Circulation, Seasonally Adjusted (1989-2019)
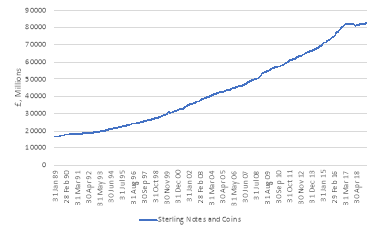
Source: Bank of England.
Monetarism[44], derived from the quantity theory of money, proposes that if the quantity of money increases, all prices increase proportionately, with no real effect on the economy (Sussman, 2019). Hume (1752) eloquently states“… the price rises, first of one commodity, then of another; till the whole at last reaches a just proportion with the new quantity of specie which is in the kingdom”. Thus, the percentage change in the money supply (M) plus the % change in velocity (V) equates to the % change in prices (P) plus the change in output (Y):
M x V = P x Y[45]
An increase in the supply of money typically lowers interest rates, which in turn, generates more investment and puts more money in the hands of consumers, thereby stimulating spending and thus increasing inflation.[46] However, the UK economy does not support this monetarist view in the relevant period, at least, as illustrated by Figure 14. Indeed, although the money supply has historically shown a correlation exists between it and inflation, since 2000, these relationships have become unstable, reducing their reliability as a guide for monetary policy (Sussman, 2019).[47]
Figure 14 – Money Supply (M4) and Inflation (1989 – 2019)
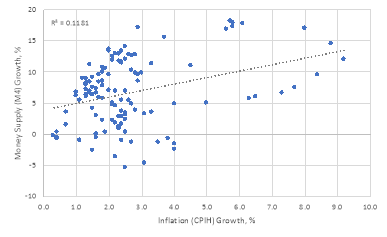
Source: Bank of England, ONS.
5. What was the exchange rate five years ago and what is it now? (By exchange rate we mean the price of the foreign currency in terms of domestic currency; be sure to state the units of the exchange rates that you post.) Has the domestic currency appreciated or depreciated during this period? What was the real appreciation/depreciation? Did interest rate parity hold during this period? If not, infer in what direction (above or below) did expectations deviate from actual changes in the exchange rate? (For those who are aware of the difference, the question is about the uncovered interest parity.)
The nominal exchange rate is the rate at which you can swap the currency of one country for another (Miles et al., 2012). The UK’s sterling (GBP) bilateral exchange rate[48] against the United States Dollar (USD) currently stands at $1.30 (Figure 15). Five years ago, it was $1.65. Thus, the sterling has depreciated 27% during this period[49].
Figure 15 – GBPUSD Quarterly Average Exchange Rate (Past 5 Years)
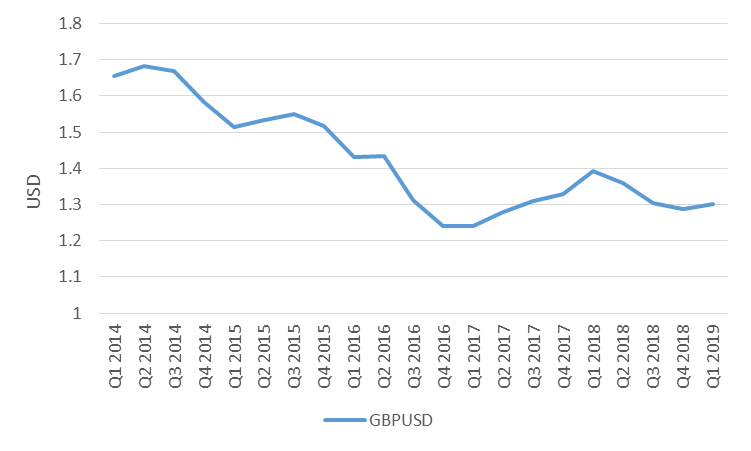
Source: Bloomberg
In contrast, the real exchange rate (RER) represents the relative cheapness, or price level of all goods and services, of one country in comparison to another (Miles et. al, 2012):
RER = Nominal Exchange Rate x Domestic Price/Overseas Price
The purchasing power parity (PPP) applies the law of one price[50] to all goods and implies that real exchange rates should equate to 1, as all countries should have the same prices and, hence, the nominal exchange rate should equal the ratio of prices between countries (Miles et. al, 2012). The Economist magazine has popularised a version of PPP with its Big Mac Index (Miles et al., 2019).[51] Utilising this index, we can obtain the real exchange rate in an easily digestible form[52]. The UK price of a Big Mac is £3.19, with the U.S. price at $5.58, thus 1.30 x (3.19 ÷ 5.58) yields an RER of 0.74. Five years ago, the RER was 0.99.[53] Hence, the real GBPUSD exchange rate has depreciated by 25% (Figure 16). The sterling is, thus, said to be undervalued against the USD by 26% today, and the PPP did not hold over this period.[54]
Figure 16 – GBPUSD Real Exchange Rate (2019 vs. 2014)

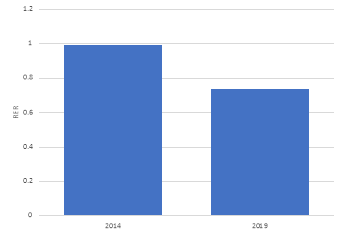
-25%
Source: The Economist, Bloomberg.
I submit that the interest parity did not hold during the period, as the expected sterling depreciation rate was well above the actual depreciation rate of 27%. “Uncovered interest rate parity (UIP) theory states that the difference in interest rates between two countries will equal the relative change in currency foreign exchange rates over the same period” (Investopedia, 2019). The expected exchange rate in the future is calculated is as follows:
F0 = S0 x [(1 + ic)/(1+ib)]n
Where F0=expected forward rate, S0=spot rate, ic= interest rate quoted currency, ib= interest rate in the base currency, and n is the number of years. The expected 5 year forward rate in 2014, utilising the UIP, was 1.65 x (1+0.25%)/(1+0.5%)5 = 1.63 (equating to an expectation of a 1% depreciation in the sterling).
Bibliography
- Bagehot, W. (1877), Lombard Street: a description of the money market, Faculty of Social Sciences at McMaster University, Chapter 6 [online]. Available from: <https://socialsciences.mcmaster.ca> [Accessed June 29 2019].
- Bank of England (2018), Further details about M0 data [online]. Accessed from: < https://www.bankofengland.co.uk/statistics/details/further-details-about-m0-data> [Accessed 1 July 2019].
- Bank of England (2019) [online]. Available from: <https://www.bankofengland.co.uk> [Accessed 2 July]
- Bank of England (2019), Inflation report – May 2019 [online]. Accessed from: <https://www.bankofengland.co.uk/-/media/boe/files/inflation-report/2019/may/inflation-report-may-2019.pdf> [Accessed 1 July 2019].
- Barro, R.J. (1987), Government spending, interest rates, prices, and budget deficits in the United Kingdom, 1701-1918, Journal of Monetary Economics, 20(2): pp. 221-247.
- Barro, R.J. & Gordon, D.B. (1983), A positive theory of monetary policy in a natural rate model, Journal of Political Economy, 91(4): pp. 589-610.
- Bernanke, B.S. (1983), Nonmonetary effects of the financial crisis in the propagation of the Great Depression, American Economic Review, 73(3): pp. 257-277.
- Binary Tribute (2019), Inflation and Interest Rates [online]. Available from: <http://www.binarytribune.com/forex-academy/inflation-and-interest-rates/> [Accessed 11 July 2019].
- Comin, D. (2006), Total Factor Productivity [online]. Available from: <http://www.people.hbs.edu/dcomin/def.pdf> [Accessed 5 July 2019].
- Comin, D., Hobijn, B. & Rovito, E. (2006), Five Facts you Need to Know about Technology Diffusion, NBER Working Paper # 11928.
- Cooray, A. (2002), The Fisher Effect: A Review of the Literature [online]. Available from: <https://www.researchgate.net/publication/5165768_The_Fisher_Effect_A_Review_of_the_Literature> [Accessed 12 July 2019].
- Crafts, N. (1991), Reversing relative economic decline? The 1980s in historical perspective, Oxford Review of Economic Policy, 7(3): pp. 81-98.
- Crafts, N. (1999), Economic growth in the twentieth century, Oxford Review of Economic Policy, 15(4): pp. 18-34.
- David, P.A. (1985), Clio and the economics of QWERTY, American Economic Review, 75(2): pp. 332-338.
- Diamond, D.W. & Dybvig, P.H. (1983), Bank runs, deposit insurance, and liquidity, Journal of Political Economy, 91(3): pp. 401-419.
- Dimson, E., Marsh, P. & Staunton, M. (2002), Triumph of the Optimists: 101 Years of Global Investment Returns, Princeton University Press, Princeton.
- Dornbusch, R. (1976), Expectations and exchange rate dynamics, Journal of Political Economy, 84(6): pp. 1161-1176.
- Economics Online (2019), Exchange Rates [online]. Available from: <https://www.economicsonline.co.uk/Global_economics/Exchange_rates.html> [Accessed 14 July 2019].
- Fisher, I. (1930), The Theory of Interest, as determined by Impatience to Spend Income and Opportunity to Invest it, New York: Macmillan.
- Fisher, I. (1933), The debt-deflation theory of Great Depressions, Econometrica, 1(4): pp. 337-357.
- Friedman, M. (1968), The role of monetary policy, American Economic Review, 58(1): pp. 1-17.
- Hall, R.E. & Jones, C.I. (1999), Why Do Some Countries Produce So Much More Output Per Worker Than Others?, The Quarterly Journal of Economics, 114(1): pp. 83-116.
- Hanushek & Woessmann (2010), Education and Economic Growth, International Encyclopaedia of Education,Oxford: Elsevier, 2: pp. 245-252
- Hulten, C.R, (2000), Total Factor Productivity: A Short Biography, National Bureau of Economic Research [online]. Available from: <https://www.nber.org/papers/w7471.pdf> [Accessed 5 July 2019].
- Investopedia (2019), Earnings Yield [online]. Available from: <https://www.investopedia.com/terms/e/earningsyield.asp> [Accessed 5 July 2019].
- Investopedia (2019), Price Level [online]. Available from: <https://www.investopedia.com/terms/p/price_level.asp> [Accessed 5 July 2019].
- Investopedia (2019), Real vs. Nominal Interest Rates: What’s the Difference [online]. Available from: <https://www.investopedia.com/ask/answers/032515/what-difference-between-real-and-nominal-interest-rates.asp> [Accessed 5 July 2019].
- Investopedia (2019), Solow Residual [online]. Available from: <https://www.investopedia.com/terms/s/solow-residual.asp> [Accessed 5 July 2019].
- Investopedia (2019), Uncovered Interest Rate Parity – UIP [online]. Available from: <https://www.investopedia.com/terms/u/uncoveredinterestrateparity.asp> [Accessed 11 July 2019].
- Investopedia (2019), What is the Relationship Between Inflation and Interest Rates? [online]. Available from: <https://www.investopedia.com/ask/answers/12/inflation-interest-rate-relationship.asp> [Accessed 12 July 2019].
- Jain, R. & Kranson, D. (2009), The Myth of GDP and Stock Market Returns, Vontobel Asset Management, Inc.
- Jan, I. (2019), Interest Rate Parity, Xplaind [online]. Available from: <https://xplaind.com/301933/interest-rate-parity> [Accessed 14 July 2019].
- Klein, N. (1999), No Logo, 1st ed., London: Picador.
- Krugman, P.R. (1994), The myth of Asia’s miracle, Foreign Affairs, 73(6): pp. 62-78.
- Lucas, R.E. Jr. (1973), Some international evidence on output-inflation tradeoffs, American Economic Review, 63(3): pp. 326-334.
- Miles, D., Scott, A. & Breedon, F. (2012), Macroeconomics: Understanding the global economy, 3rd ed., Chichester, UK: Wiley.
- MSCI Barra Research (2010), Is There a Link Between GDP Growth and Equity Returns? [online]. Available from: <https://www.msci.com/documents/10199/a134c5d5-dca0-420d-875d-06adb948f578> [Accessed 13 July 2019].
- Office for National Statistics (2019) [online]. Available from: <https://www.ons.gov.uk/> [Accessed July 2019].
- Pettinger, T. (2017), Difference between GNP, GDP and GNI, Economics Help [online]. Available from: <https://www.economicshelp.org/blog/3491/economics/difference-between-gnp-gdp-and-gni/> [Accessed 5 July 2019].
- Phillips, A.W. (1958), The relation between unemployment and the rate of change of money wage rates in the United Kingdom, 1861-1957, Economica, 25(100): pp. 283-299.
- Ritter, R. (2005), Economic Growth and Equity Returns, Pacific-Basin Finance Journal, 13 pp. 489-503.
- Schneider F., Buehn, A. & Montenegro C.E. (2010), Shadow Economies All Over the World. New Estimates from 162 Countries from 1999 to 2007, Policy Research Working Paper No. 5356, Washington, DC: World Bank.
- Solow, R.M. (1956), A contribution to the theory of economic growth, Quarterly Journal of Economics, 70(1): pp. 65-94.
- Solow, R.M. (1957), Technical change and the aggregate production function, The Review of Economics and Statistics, 39(3): pp. 312-320.
- Suarez, J. & Sussman, O. (1999), Financial distress and the business cycle, Oxford Review of Economic Policy, 15(3): pp. 39-51.
- Sussman, O. (2019), Firms & Markets Course Materials: Macroeconomics, Oxford: University of Oxford.
- Tutor2u (2019), Floating Exchange Rates [online]. Available from: <https://www.tutor2u.net/_legacy/blog/files/Revision_Floating_Exchange_Rates.pdf> [Accessed 14 July 2019].
- Wall Street Mojo (2019), GDP vs GNP [online]. Available from: <https://www.wallstreetmojo.com/gdp-vs-gnp/> [Accessed 5 July 2019].
- White, L.J. (1993), A cautionary tale of deregulation gone awry: The S&L debacle, Southern Economic Journal, 59(3): pp. 496-514.
- Wikipedia (2019), Money Supply [online]. Available from: <https://en.wikipedia.org/wiki/Money_supply> [Accessed 14 July 2019].
- Wu, J. (2012), The linkage between Stock Market Returns and GDP Growth Rate in the United States [Online]. Available from: <http://citeseerx.ist.psu.edu/viewdoc/download?doi=10.1.1.877.9459&rep=rep1&type=pdf> [Accessed 13 July 2019].
[1] The main difference is that GNP considers the income receipts by the country in question’s national citizens from abroad. GNP is usually calculated by taking the sum of individual consumption expenditures, private domestic investment, government expenditure, net exports and any income earned by residents from overseas investments, minus income earned within the domestic economy by foreign residents (Sussman, 2019). Net exports represent the difference between what a country exports minus any imports of goods and services (WallStreetMojo, 2019). The GNP formula is: GNP= GDP + NR – NP. Where NR= Net Income Receipts, NP= Net outflow to foreign assets.
[2] Economics is the study of the allocation of scarce resources. Macroeconomics examines the economy in aggregate – it looks holistically at the outcomes of all decisions that governments, corporations and consumers make in an economy. Long-term macroeconomic questions examine issues such as: the role of investment in machines and infrastructure to foster growth; the importance of skills and educ
Cite This Work
To export a reference to this article please select a referencing stye below:
Related Services
View all


DMCA / Removal Request
If you are the original writer of this assignment and no longer wish to have your work published on UKEssays.com then please click the following link to email our support team:
Request essay removal