Coffee Consumption and Production (UPDATE)
| ✓ Paper Type: Free Assignment | ✓ Study Level: University / Undergraduate |
| ✓ Wordcount: 2027 words | ✓ Published: 11 May 2021 |
Introduction: Café culture
Coffee, tea and cocoa are all common beverages consumed by millions of people around the world. In terms of trade, Coffee is the second only to oil in terms of dollars. In short, coffee consumption and production is a major economic reality in the 21st century. However, Coffee is often produced in LEDC countries and sold to MEDC countries. This report would be split into 4 sections:

- Producers, Supply Chain and Consumers
- Development, Interconnections
- Case Study
- Solution/conclusion
Product Grown and why there?
Due to the high demand in coffee, it is grown in more than 50 different countries with 30 of these countries accounting up to 5,000,000 tons of coffee each year. Some countries economy has risen in the past few years mainly due to its success in their coffee crops such as Vietnam. Brazil by far is the largest producer of coffee accounting about 1/3 of all the coffee in the world and has been for the last 150 years thanks to its location and climate making it the perfect place to grow coffee beans.
Because coffee beans require a specific temperature and humidity range, rainfall, soil and altitude (4500 feet) to be grown successfully. As a result, this generally limits the areas to grow coffee beans between the Tropic of cancer and the Tropic of Capricorn. This area is often referred to as the coffee belt (as seen in figure 2) passing from Mexico, Brazil, Ethiopia, India, Southeast Asia etc. With the exception of China lying outside ‘Bean Belt’ however still managing to produce coffee as seen in figure 3.
Figure 1 https://perfectdailygrind.com/2015/06/how-does-altitude-affect-coffee-and-its-taste-in-the-cup/

Where coffee bean are grown in the world
Figure 3
Source: https://www.quora.com/Are-there-places-in-the-U-S-conducive-to-growing-coffee-beans
Scale: Unknown
Coffee beans tend to grow best in the tropics where temperatures range from 15–30 degrees. While the rainfall needs to average between 1,500 to 2,500 mm per year and the humidity maintained anywhere between 70–90% and altitude best above 4000 feet as mentioned in figure 1. The soil needs to be well-drained, deep, and rich in organic matter with the coffee trees planted on gentle slopes facing north, east or a north-easterly direction.

Figure 4 shows the climate of Mato Dentro Brazil has an average temperature of about 18-24 degrees throughout the year and receiving an average of 270mm during the summer as well as high humidity throughout the year. Making it perfect for the growth and production of coffee beans.

Compared to figure 4, Kinshasa is level to the sea level. However, it is still able to produce coffee as the average temperature all year round is about 25.5 degrees C. With relatively high humidity and an average amount of rainfall. With the exception of July, August and June. Making it a perfect place to grow coffee as well.
Supply chain
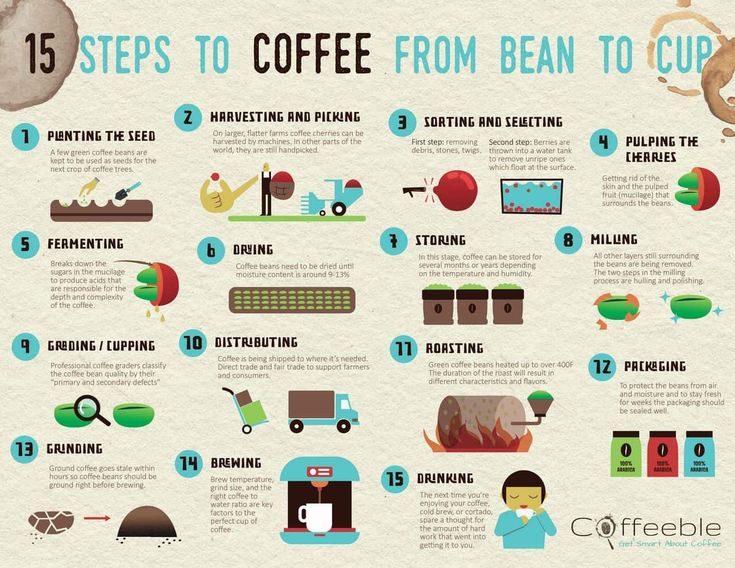
The first step in the supply chain is for the producers to grow the coffee bean. The next step is to harvest the beans. Which are then sorted and processed, this needs to be done quickly to prevent spoilage. The beans are then dried and milled and exported to different parts of the world (mostly to MEDC). It is then the beans are roasted and ground, ready to be brewed for people to consume. From steps 1 to 9, in in figure 6, most of that is done in LEDC like Brazil, Vietnam, Ethiopia and from step 10 onwards its usually MEDC such as Germany, USA and Italy.


Who imports the products

As shown in figure 8, coffee appears to be imported by every country in the world mainly MEDC’s in a scattered pattern such as Russia, North America, Australia 2/3 of Europe. However, there is an exception with Algeria, despite being part of an LEDC, Algeria is the 4th largest gas exporter and 10th in the oil industry. There is also a country that doesn’t import coffee which is Greenland. This could be due to the fact that it is quite isolated and only has a population of around 55000 people (world bank 2018).
Top 10 Coffee Importers
|
Countries |
Amount spent per year (USD) |
|
United States |
$5,841,573,000 |
|
Germany |
$3,228,205,000 |
|
France |
$2,731,272,000 |
|
Italy |
$1,642,404,000 |
|
Japan |
$1,248,034,000 |
|
Canada |
$1,196,366,000 |
|
Netherlands |
$1,194,042,000 |
|
Belgium |
$1,080,895,000 |
|
United Kingdom |
$1,058,625,000 |
|
Spain |
$969,608,000 |
Figure 9: Top 10 coffee importers
This is a table showing the top 10 coffee importers in the world and how much they spent on coffee in 2019. As seen in the table, the US has spent close to $6 billion USD on coffee while second place, Germany has only spent $3.3 billion USD. This is a massive drop. However, after that, the rest of the countries seem to just steadily decline.
Production and Consumption – Development of Countries
As mentioned above in figures 1 and 2, most of the Coffee is grown in LEDC except China and the US. However, the tables are turned when it comes to importers. As seen in figure 9 and 10, all the countries that consume and import are MEDC’s. However, figure 8 shows that there is an exception with Algeria. And that is mainly due to the fact that they are one of the top 5 importers on gas and top 10 in oil. The link between the LEDC’s and MEDC’s are fairly important. This is because MEDC’s rely on LEDC’s to produce coffee.
And if for some reason they stopped, then it would only be the US (6350kg coffee produced per year) and China (116820000kg coffee produced per year). However, this is nowhere near meeting the demands on coffee today. Same goes with the producers if people stopped consuming coffee, countries such as Brazil and Vietnam rely on the coffee industry will go broke. And millions of people would lose their jobs.
Top 10 countries that import/export coffee 2019
Top Countries that Produce coffee |
Amount produced metric tons (000, s) per year |
Top Countries that consume coffee |
Amount consumed per person (annual) |
Brazil |
2,592 |
Finland |
12kg |
Vietnam |
1,650 |
Norway |
9.9kg |
Colombia |
810 |
Iceland |
9kg |
Indonesia |
660 |
Denmark |
8.7kg |
Ethiopia |
284 |
Netherlands |
8.4kg |
Honduras |
348 |
Sweden |
8.2kg |
India |
348 |
Switzerland |
7.9kg |
Uganda |
288 |
Belgium |
6.8kg |
Mexico |
234 |
Luxembourg |
6.5kg |
Guatemala |
204 |
Canada |
6.2kg |
Figure 10
How are countries interconnected through trading of the product?
Jobs created in exporting country |
Jobs created in importing country |
|
Farming |
Hospitality industry |
|
Shipping |
Transportation |
|
Manufacturing |
Coffee seller |
|
Packaging |
Railway and dock |
|
Railway and dock |
The network created between importing and exporting countries largely contributes towards the growth of the economy especially in third world coffee-producing countries such as Brazil, Vietnam Cambodia etc. Importing and exporting products such as coffee between countries also creates job opportunities for both parties such as railway and dock workers, coffee shop owners, shipping companies, truck drivers etc.
Additionally, as the demands for the product increases, countries that are interconnected through the product also creates trade and economic interdependence. Currently, there is quite a large independence between countries that produce coffee and countries that manufacture/consume it. For example, there are over 200 million coffee growers and over 1 billion people that consume coffee. However, they both rely on each other.
Stopping Production Scenario
If consumers were to suddenly stop enjoying their morning coffee, these countries that rely on coffee to bring up their economy would find themselves in a lot of trouble. For example, the Covid-19 pandemic caused borders between countries shut down. As a result, coffee farmers cannot export their coffee meaning they won’t have an income to support their families. Take Ethiopia as an example, if a natural disaster is to hit Addis Ababa, an area in Ethiopia where coffee is grown, farms would be destroyed not only causing the farmers and truck drivers, to lose their jobs but also cause grief for the country that the natural disaster hit. Countries that rely on Ethiopia on coffee would also have their supply cut off. As well as smaller business owners that need the coffee to run the shop.
Case Study – Diamond Enterprise of Dahab Coffee, Ethiopia
Diamond Enterprise is one of the many coffee companies in Ethiopia. The coffee beans are nursed for 8-9 months before being planted in the Kaffe Forest. When ripe, the coffee beans are carefully chosen and handpicked, dried, sent to its export office to be packaged and ready to be exported worldwide. Which in most cases is done via boat because of the large quantities it is shipped in.
Next, the coffee beans would be loaded off ports of the countries that import the product and brought into supermarkets or coffee shops ready to be sold to consumers. (further information on Dimond Enterprise can be found on the link https://www.dahabcoffee.com/about). Figure 10 shows the locations of the farm and the export office of Dimond Enterprise Plc.

- Red marker is the coffee farm
- Blue marker is the export office
Figure 10 Scale: unknown https://www.google.com/maps/d/u/0/edit?hl=en&hl=en&mid=11XzUbRZGKV17bjQ20kEoMxny3d6N6jOy&ll=8.996062070663358%2C37.84095011228242&z=7

Solutions and strategies to issues around coffee
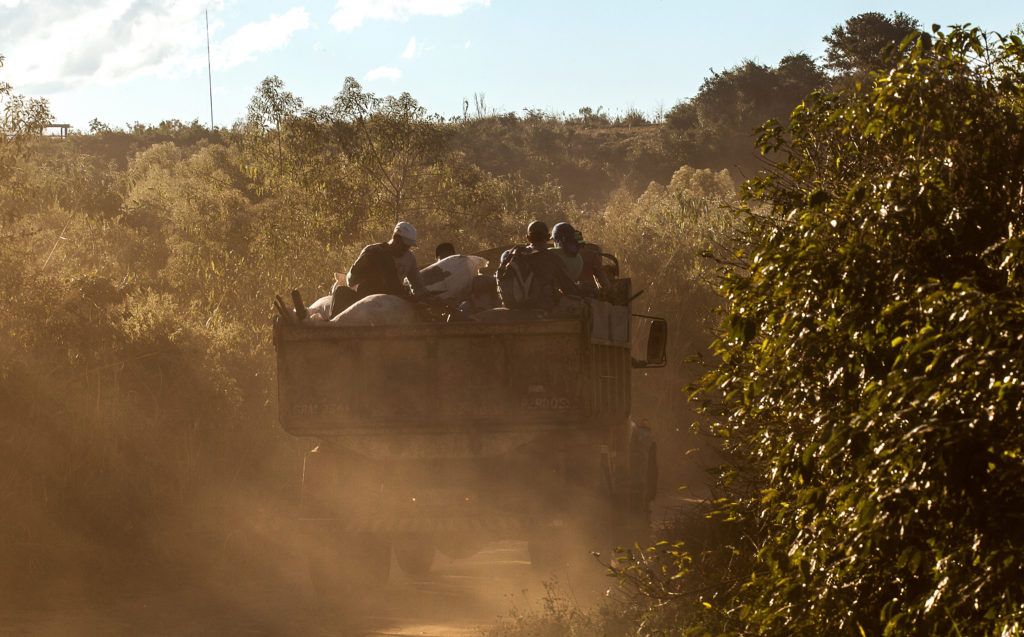
Although coffee is one of the most consumed drinks in the world, not many people realise that behind all those massive coffee companies, the farmers that are supplying the coffee aren’t always fairly treated. For example, more than 40% of coffee farmers in Brazil are underpaid (3-5 dollars a day) with the minimum wage being about $190 a month. Natural disasters also make their lives that much more difficult. Furthermore, the coffee workers are transported to the plantation as a group, often in poorly maintained trucks or tractors pulling wagons as seen in figure 11. Not only is this extremely unsafe, and for years, the government turned a blind eye until 2015 at the FETAEMG meeting, transportation accidents were
Figure 11 Group of coffee pickers traveling to plantation site on unsafe transport
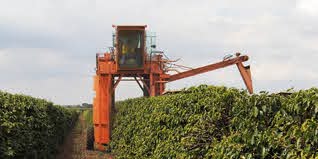
listed as a serious accident. Moreover, it’s the company that manufacture coffee that gets the praise if the coffee is good, forgetting about the people that actually grew the beans. To deal with these issues, many MEDC’s have suggested that coffee farms should start using coffee picking machines. Yet not only would this make coffee pickers lose their jobs but some farms many not be able to afford this. However, organisations such as Techno Serve are raising awareness, donating and helping small coffee farms work through challenges. As well as Fairtrade International, making sure that coffee farmers in LEDC’s are being treated and paid fairly by their employers. But we can also do our bit by donating to these organisations.


Figure 14 Fairtrade logo
Figure 13 Coffee picking machine

Conclusion
In conclusion, coffee is one of the most consumed drinks in the world having a long process from becoming bean to a cup of coffee however not stopping the fact that many countries are spending billions of dollars on it each year. This not only connects countries together but also form interdependence and support for one another. For example, if a natural disaster was to occur, countries would help them.
Although the coffee trade isn’t always fair, it is a necessity for some people and if it were to somehow disappear, people would be struggling. Overall, coffee is a huge factor in why the world is globally interconnected.
References for Coffee Consumption and Production
- En.wikipedia.org. 2020. Coffee Production In Democratic Republic Of The Congo. [online] Available at: [Accessed 17 November 2020].
- Poet, B., 2020. The Coffee Belt: Coffee-Growing Regions Of The World. [online] Bean Poet. Available at: [Accessed 17 November 2020].
- Pikelhaizen, A., Pikelhaizen, A. and Pikelhaizen, A., 2020. The Draught In The Brazilian Coffee Belt Is History | Wolthers Douque. [online] Wolthersdouque.com. Available at: [Accessed 23 November 2020].
- Farrer, J., 2020. Top 10 Coffee Producing Countries Around The World – Farrers Coffee. [online] Farrers Coffee. Available at: [Accessed 24 November 2020].
- Weaverscoffee.com. 2020. The World’s Top Coffee Consuming Nations. [online] Available at: [Accessed 24 November 2020].
- Dahabcoffee.com. 2020. Diamond Enterprise Plc. – About. [online] Available at: [Accessed 25 November 2020].
Cite This Work
To export a reference to this article please select a referencing stye below:
Related Services
View allDMCA / Removal Request
If you are the original writer of this assignment and no longer wish to have your work published on UKEssays.com then please click the following link to email our support team:
Request essay removal


